Note: The representation of decimal numbers varies across countries, and there are two main conventions: the comma (“,”) and the dot (“.”) as the decimal separator.That’s why I’ve prepared the files for both cases, if you are located in European country then download EU files otherwise download Non-EU Files.If for some reason you are having problems with the CSV file – post a question in the course.
Download ONLY one ZIP File depending on your locaiton:
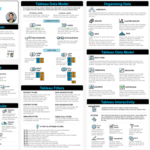
I’ve created three Tableau cheat sheets for you—perfect for swift access during your learning journey or while diving into Tableau projects. No need to memorize everything; I still use them myself! 😅
In this cheat sheet, you will find quick descriptions of key Tableau concepts such as Tableau products, Tableau Models, Joins, Relationships, Filters, Dimensions/Measures, Discrete & Continuous, Parameters, Project steps, and many more!
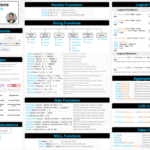
In this cheat sheet, you will find quick access to the syntax of the most commonly used Tableau functions, with simple examples and descriptions. All 4 types of Tableau calculations are covered: Row-Level Calculations, Aggregate Calculations, LOD Expressions, and Table Calculations
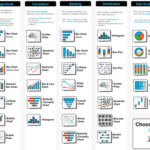
In this cheat sheet, you will find different charts listed under seven categories. This will help you in designing the mock-ups of your charts, opening your eyes to different possibilities, and helping you choose the right chart!
Tableau Sketchnotes & Slides
For this course, I’ve created over 130 simple sketchnotes and put together 120 animated slides. These visuals help break down complex Tableau concepts.
In my other courses, many students wanted to use my sketches as a reference. That’s why I’ve gathered everything from this course into two PDF files
133 Sketchnotes are covered throughout the entire Tableau course. I’ve spent a significant amount of time drawing and sketching because I believe visuals are a powerful method to explain complex concepts, making it easier for you to understand
123 Slides focus on Tableau Calculations. In Section 12, ‘Tableau Calculations,’ I’ve explained all functions by first explaining the concept behind each function and show how they work in Tableau with straightforward examples. You can find all the concepts and examples in these slides.
Tableau User Story | Sales Performance
Intorduction
This user story outlines the specifications for building two dashboards using tableau to help stakeholders, including sales managers and executives to analyze sales performance and customers.
Sales Dashboard | Requirements
Dashboard Purpose
The purpose of sales dashboard is to present an overview of the sales metrics and trends in order to analyze year-over-year sales performance and understand sales trends.
Key Requirements
KPI Overview
Display a summary of total sales, profits and quantity for the current year and the previous year.
Sales Trends
– Present the data for each KPI on a monthly basis for both the current year and the previous year.
– Identify months with highest and lowest sales and make them easy to recognize.
Product Subcategory Comparison
– Compare sales performance by different product subcategories for the current year and the previous year.
– Include a comparison of sales with profit.
Weekly Trends for Sales & Profit
– Present weekly sales and profit data for the current year.
– Display the average weekly values.
– Highlight weeks that are above and below the average to draw attention to sales & profit performance.
Customer Dashboard | Requirements
Dashboard Purpose
The customer dashboard aims to provide an overview of customer data, trends and behaviors. It will help marketing teams and management to understand customer segments and improve customer satisfaction.
Key Requirements
KPI Overview
Display a summary of total number of customers , total sales per customer and total number of orders for the current year and the previous year.
Customer Trends
– Present the data for each KPI on a monthly basis for both the current year and the previous year.
– Identify months with highest and lowest sales and make them easy to recognize.
Customer Distribution by Number of Orders
Represent the distribution of customers based on the number of orders they have placed to provide insights into customer behavior, loyalty and engagement.
Top 10 Customers By Profit
–Present the top 10 customers who have generated the highest profits for the company.
– Show additional information like rank, number of orders, current sales, current profit and the last order date.
Design & Interactivity Requirements
Dashboard Dynamic
– The Dashboard should allow users to check historical data by offering them the flexibility to select any desired year.
– Provide users with the ability to navigate between the dashboards easily.
– Make the charts and graphs interactive, enabling users to filter data using the charts.
Data Filters
Allow users to filter data by product information like category and subcategory and by location information like region, state and city.